Work Aggregation
【For administrators】
Here is the explanation of work aggregation function.
Tasks can be aggregated for each work content.
※ In order to compile work contents, it is necessary to register master of ''work contents'' beforehand.
Register work places and work contents
Example, It will be useful if you want to know how much time you spent having meetings.
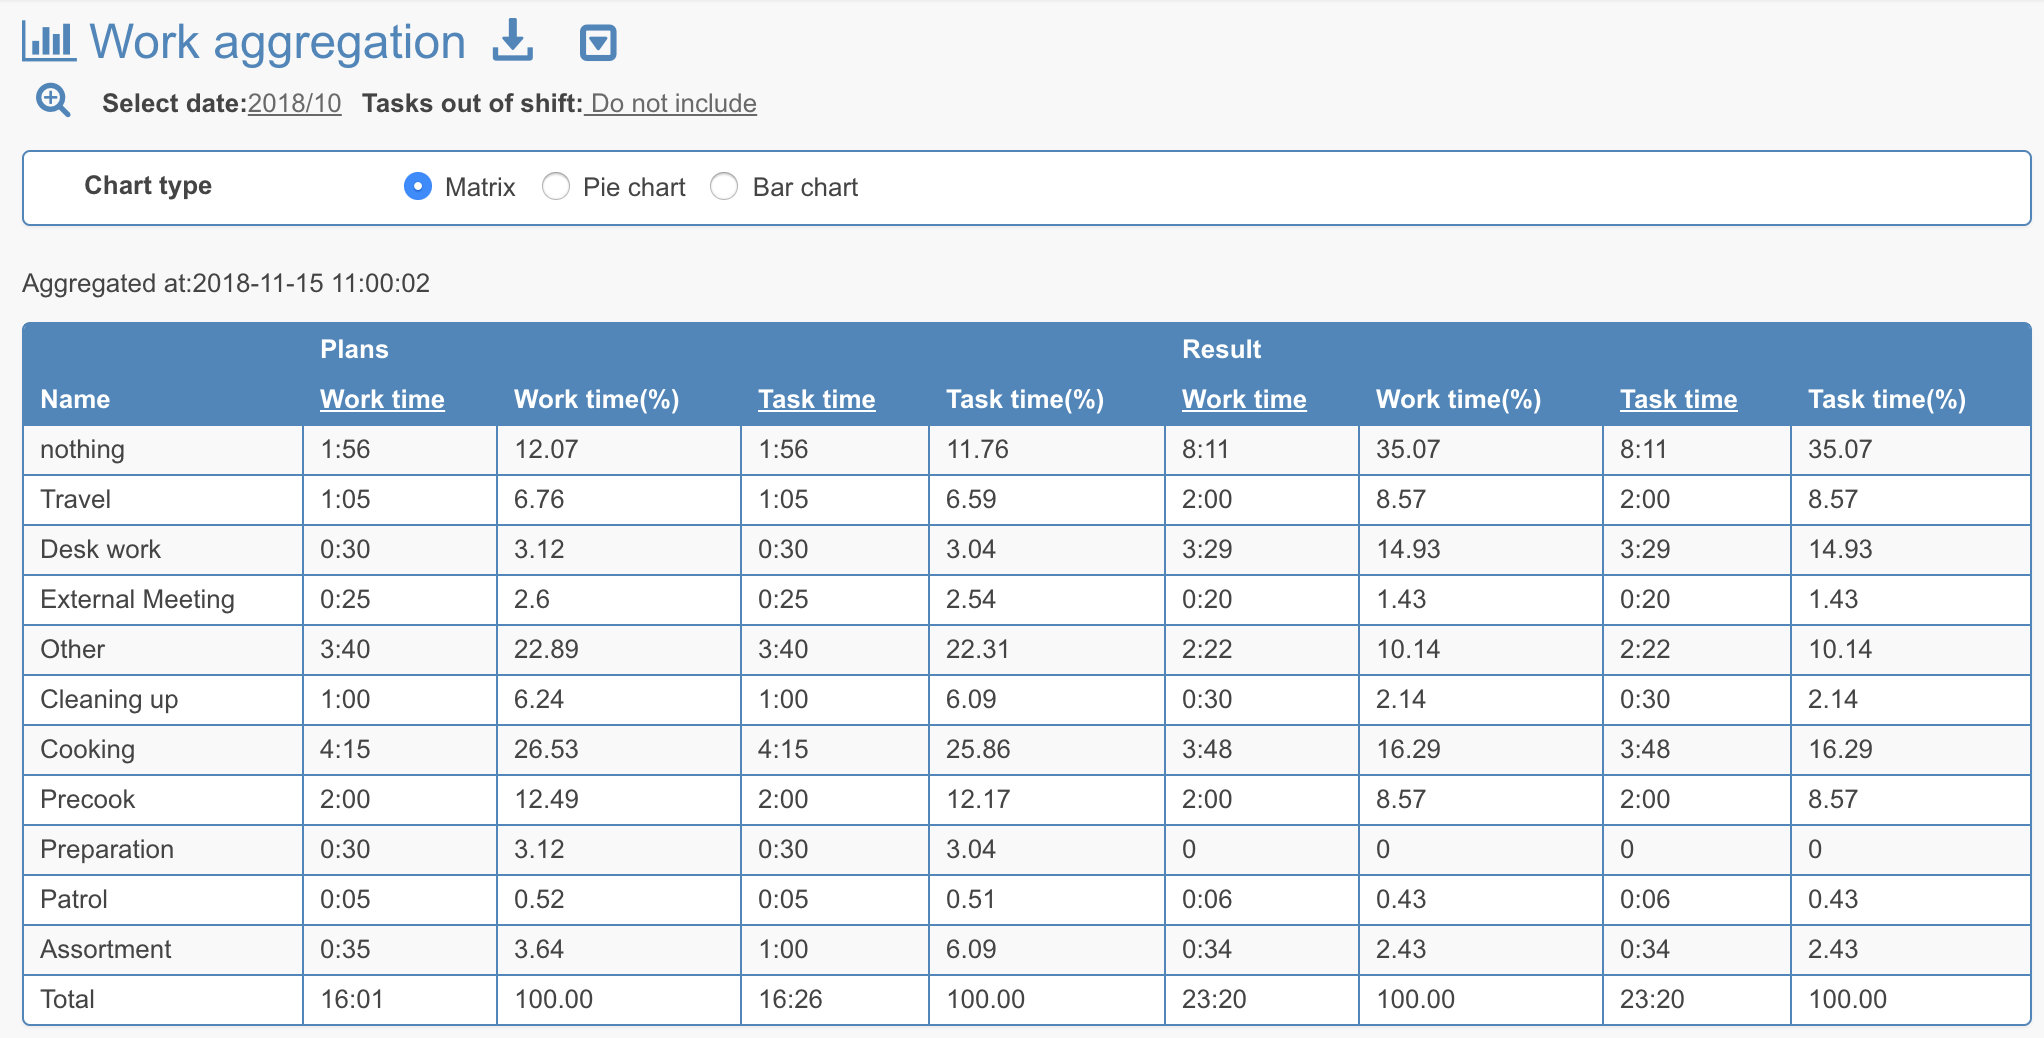
Since it is aggregated by task plan and actual results, you can compare the time you are planned to spend and how much you actually spent working on that task.
This aggregation are available in table, pie chart, and bar graph. You can visually check the data.
These contents can be exported. For details, please check here. (The link is currently available only in Japanese.)
- Click work aggregation
.png)
- Click on search field to specify the contents you want to check.
.png)
.png)
Group: Specify a group.
Employee: Specify the employee. (Only one person can be selected)
Select date: Specify the day, month, and period. (Current month is selected by default)
Payment date group: Specify the payment date group.
Work contents: Only the specified work content will be displayed when you select a content in this field.
Work content tag: Only the specified work content tag will be displayed when you select a content in this field.
Tasks out of shift *1: Tasks that have been done out side the shift working hours.
- The aggregated data will be displayed
You can switch the data to Matrix, Pie chart, and Bar chart.
Work time: Hours spent on tasks during the shift will be aggregated.
Task time: Total hours spend on tasks including the time outside the shift will be aggregated.
[Chart type: Matrix]
[Chart type: pie chart]
You can see at a glance how much time you spend on which task.
If the task is not performed as scheduled as shown in the figure below, you can lead to the improvement of business by finding out why the task was not performed as scheduled.
.png)
[Chart type: Bar chart]
You can see the difference between plans and results at a glance.
You can easily check if the work went as planned.
.png)
*1 Tasks out of shift :It refers to tasks which is registered when the employee attendance status is not at work.
Example) Tasks such as travelling to a business trip destination a day before(The travelling day is on holiday).
